
In the world of print and media we are constantly finding new ways to represent data and figures. Sometimes this data is very complex–as is the case with sports statistics.The following infographic was designed by Rachel Needle, the Rollins Fellow for the Office of the Yale University Printer in anticipation of a new season for the 2013 National Champion Bulldogs. For information more about the process she used to develop the infographic please follow the University Printer’s blog Y Design here.
- Main Menu
- Sub Menu
-
Products & Services
Apps & Digital Publications
 YPPS develops customized apps for all mobile platforms. We will meet with you to determine your exact needs and develop your app from the ground up. Contact YPPS Customer Support for more information.
 -
BluePrint Copier Rental
 The YPPS BluePrint Team manages the Copier Rental Program and the PaperCut Program, we customize our services based on your specific needs.
 -
Promotional Solutions
Promotional Solutions from YPPS
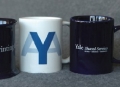 Over the last 25 years, YPPS has been able to procure and provide top quality custom specialty items and more to the Yale community. With a dedication to quality, turnaround, and cost, our Promotional Items & Solutions department has partnered with local Yale-approved vendors to produce all of our products. We take pride in knowing that we can facilitate these projects with great service and quality.
Please use these web pages as a guide to better understand how we can help you with your promotional events and projects.
For options, specifications, and cost estimates, contact us by calling or emailing:
Edward Van Keuren @ 203-432-7076 edward.vankeuren@yale.edu
Carmen Cusmano @ 203-432-3540 carmen.cusmano@yale.edu -
About YPPS
YPPS Mission
 YPPS is dedicated to supporting the University’s evolving media needs both educational and administrative with excellent customer support, resourceful solutions and indispensable services.
Questions? Contact Us Here